ASCENSION PATH
From Chaos to Structure
Level 0 – The Raw Market
(No indicators. No excuses.)
In front of you is a clean market chart in its purest form.
No indicators.
No signals.
No hints.
Just price candles.
A simple question: “If this were your chart, where would you trade?”
Pause for a moment. Don’t answer too quickly.
Most traders, at this moment, will:
- Pick a few spots that “feel” reasonable
- Lean on instinct, hope, or fragments of past experience
At this level, each choice is personal. There is no right or wrong here – only raw belief.
Level 1 – Signal overload
(More information. Less clarity.)
It’s the same chart. But this time, Buy and Sell signals appear everywhere.
A new question arises: “Among all these signals, which one would you choose to trade?”
Very quickly, you might find yourself overwhelmed by:
- Too many signals firing at once
- Knowing you can’t act on all of them
- Not having a clear rule to filter out weak ones
In this state, traders often:
- Pick the signals that simply look good
- Choose signals only after seeing how they played out
- Change their decision again and again
Each trader has their own view and decision. But this level makes one thing obvious:
More information does NOT necessarily create greater clarity.
Level 2 – Add Trend
Now imagine this:
The chart is still filled with Buy/Sell signals, but this time there’s one more piece of information.
It’s not an entry signal. It’s just a hint about the market’s overall direction – the trend bias.
From here, the question is: “Which signal should you take?”
You might start to notice that:
- Some signals naturally lose validity
- A few options you were considering fall away
- You no longer have to think as hard to filter them
At this level, several signals stop qualifying – not because they were wrong, but because they no longer align with the broader context.
Level 3 – Add Zone
The trend is now clear, but the chart still presents many possible entry points.
So, let’s add one more layer of clarity. Key price zones appear – areas where the market has reacted strongly in the past.
The final question is: “Which signals make sense to trade?”
You might find yourself ignoring most of the signals. Your attention naturally shifts toward the zones that truly matter.
And once that happens, the urge to rush into trades fades.
You finally have a reason to wait… to wait for a setup clear enough to deserve a trade.
Pause here!!!
A shift in how you see the market…
Take a moment to look back at how you just analyzed the chart.
You moved from price → trend → zones → signals. That’s a structured, logical sequence.
But in real trading, most traders don’t follow this path. They jump straight to the signals.
A Buy arrow, a Sell marker – and their mind is already halfway into the trade. They pick whatever looks “promising”.
No trend.
No zone.
No context.
Just the signals.
Only afterward do they start filling in the missing pieces. They explain the trend after they’ve already entered.
They draw zones to justify the position. They reshape the narrative to make the trade feel “right”.
Some don’t even bother with trend or zones at all. A signal appears – and that alone feels like enough to pull the trigger.
In other words, their decision-making begins with the signal – NOT the market. And that’s why:
- They keep switching indicators
- They keep asking which signal feels “better”
- They rarely feel any real sense of certainty
The experience you just went through was intentionally designed to move you in the opposite direction of how most traders approach the market:
- You began in a state of pure signal overload.
- So many signals that it was difficult to decide what mattered.
- Then, gradually, layers of context – Trend, Zone – were added.
- Each new layer naturally removed the weaker setups from your view.
There were no instructions telling you what you should do. You simply noticed it yourself:
“If I had this context first, I wouldn’t have chosen those signals.”
That moment is the psychological shift – a subtle but powerful change in how you interpret the chart.
The moment you realize: “There is a structure. And that structure doesn’t begin with signals.”
And this is where the most important part begins.
Ascension Path – UTF Basic
What you just experienced wasn’t a random scenario. It reflects the core structure of Ascension Path – the foundational layer of Universal Trading Framework (UTF).
UTF is a structured framework for understanding market behavior. It explains how a trading edge is formed, sustained, and ultimately unfolds before, during, and after a trade.
To make it practical, UTF is summarized through one foundational equation: E = (T × Z × S) × M
- E – Edge
- T – Trend
- Z – Zone
- S – Signal
- M – Management
Each component – Trend, Zone, Signal, and Management – plays a distinct role in shaping Edge (E).
Management, in particular, determines how you protect capital, optimize returns, and preserve Edge over time.
What Ascension Path truly addresses
Ascension Path defines the structured progression behind a professional trading decision-making process:
Trend → Zone → Signal → Management
When this sequence breaks down, the familiar problems traders face begin to appear:
- Collecting countless indicators without knowing what’s missing
- Seeing a signal → jumping into a trade immediately
- Focusing on signals yet still losing
- Losing → switching to a new indicator
- Winning → but having no idea why it worked
Ascension Path answers a question most traders can’t resolve clearly:
“Why can the same indicator work for some traders but NOT for others?”
The difference doesn’t lie in the indicator.
It lies in how that indicator is used within a complete, structured decision process – the very foundation of Ascension Path.
You can think of it as:
- A system’s structural backbone
- A systematic decision-making sequence
- A unified trading framework
All of these describe what Ascension Path represents.
Example: A strategy built on Ascension Path
Ascension Path should now be clear as the structural logic behind a complete trading process. From here, we will examine how this framework translates into an actual, actionable strategy.
Step 1 – Identify Trend
The trend is determined using SuperTrend Pro. On the chart above, it identifies the market as bullish, meaning:
- You think only in the direction of buying.
- All selling ideas are removed upfront.
- You avoid counter-trend trades and top-picking.
At this point, no trades are taken and all signals are ignored.
Step 2 – Identify Zone
Once Trend is established, the next step is to define Zone – the price areas that actually matter.
In this example, VoluTank Army highlights 2 key zones:
- Support zone
- Resistance zone
Because Trend is bullish, your focus narrows to 2 valid scenarios:
- A pullback into the Support zone → preparing for a buy setup
- A breakout through the Resistance zone → preparing for a continuation buy
At this point, your priority is clear: Identify the price areas where an entry would become valid.
Step 3 – Identify Signal
Trend set. Zone defined. Now you look for Signal. OmniSpectrum Scan provides it.
A Buy signal is valid only when it meets 2 criteria:
- It aligns with SuperTrend Pro’s bullish bias.
- It appears inside the zones defined by VoluTank Army
On the chart above, the 2 circled Buy signals meet both conditions.
→ These are the exact moments to execute a Buy under Ascension Path logic.
Final thoughts
Ascension Path you’ve just walked through isn’t a trading strategy. It’s not a Buy/Sell system either.
It is a foundational structure that every professional trader relies on to make decisions – whether they realize it or not.
At this stage, you’ve only touched the surface of UTF. But by now, you’ve grasped the core principles:
- Why Signal cannot stand on its own
- Why Trend and Zone are never secondary elements
- Why most losses come not from indicators, but from lacking structure
- And most importantly: You now see which part of your own strategy has been missing
If you want to go deeper and unlock the full UTF, you can access it here:
Email:
Button: Get FREE access to UTF
ASCENSION PATH
From Chaos to Structure
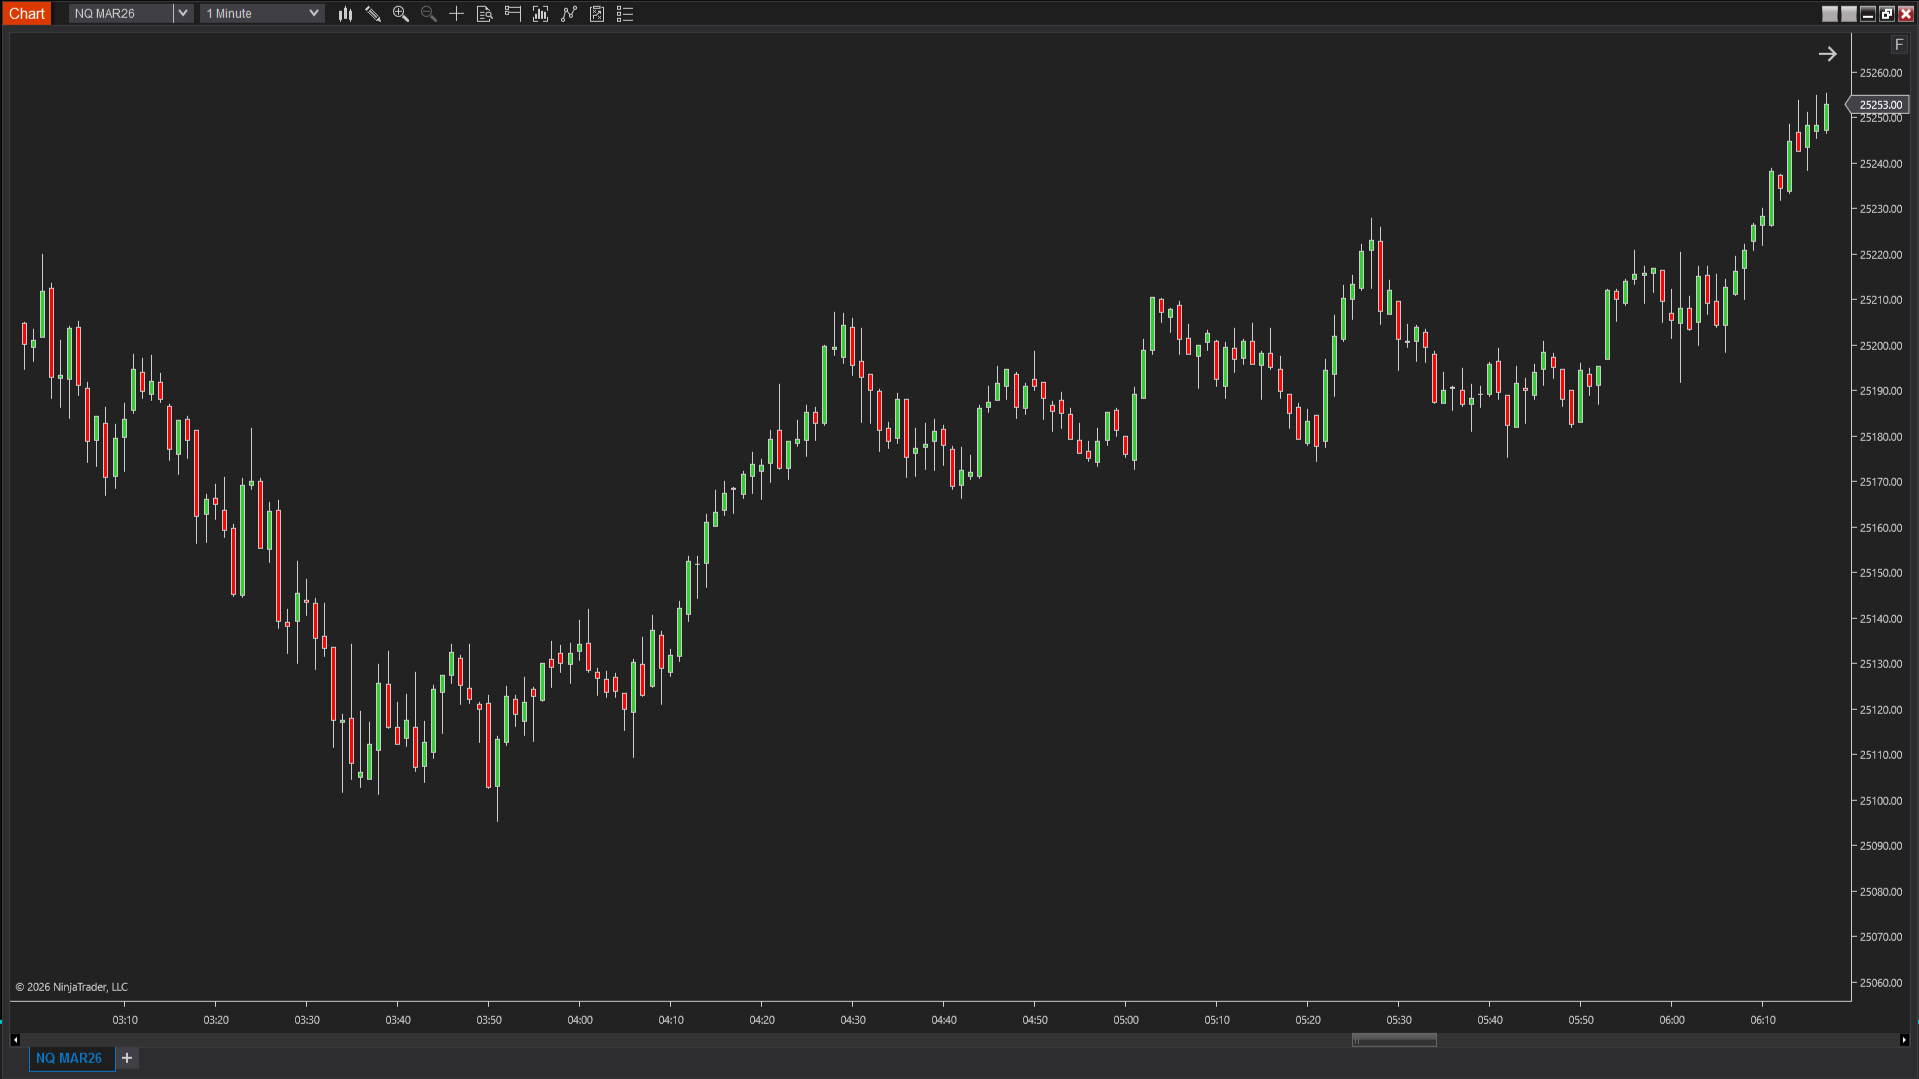
Level 0 – The Raw Market
(No indicators. No excuses.)
Image 1
In front of you is a clean market chart in its purest form.
No indicators.
No signals.
No hints.
Just price candles.
A simple question: “If this were your chart, where would you trade?”
Pause for a moment. Don’t answer too quickly.
Most traders, at this moment, will:
- Pick a few spots that “feel” reasonable
- Lean on instinct, hope, or fragments of past experience
At this level, each choice is personal. There is no right or wrong here – only raw belief.
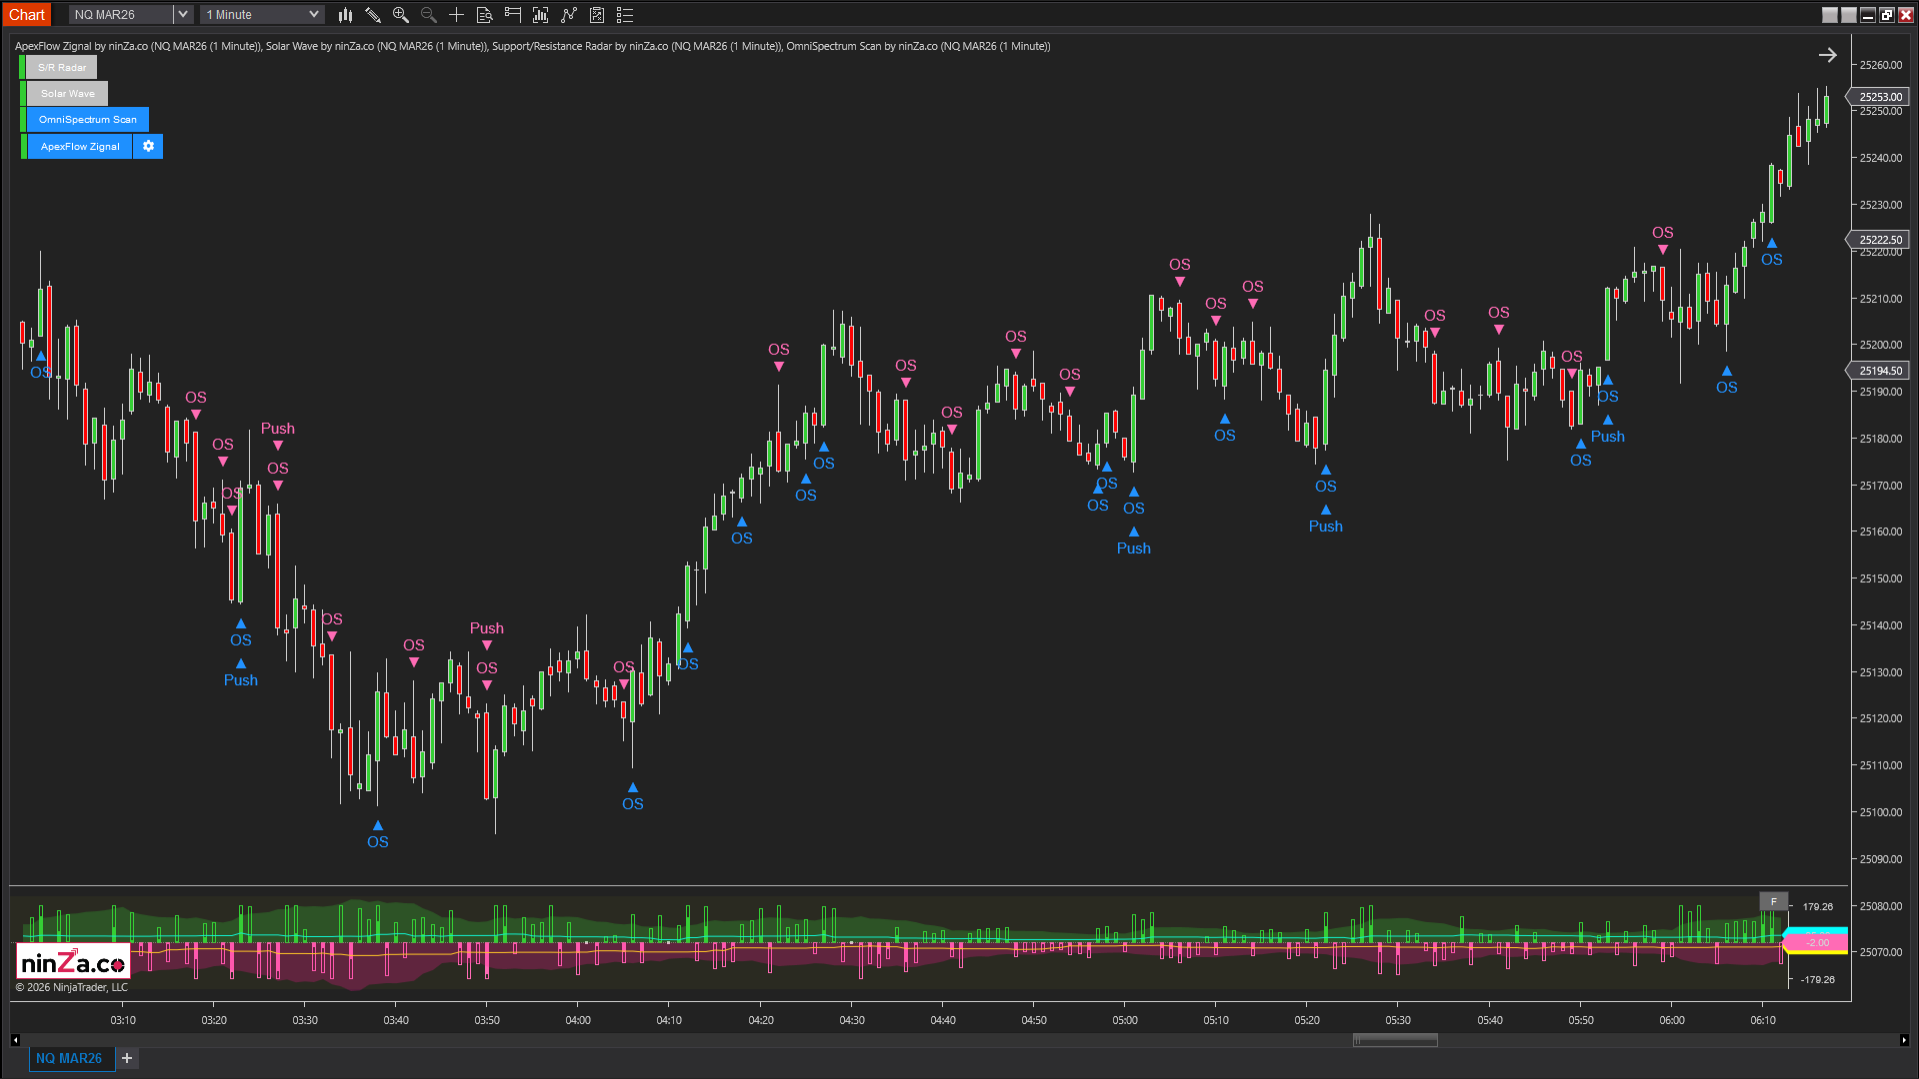
Level 1 – Signal overload
(More information. Less clarity.)
Image 2
It’s the same chart. But this time, Buy and Sell signals appear everywhere.
A new question arises: “Among all these signals, which one would you choose to trade?”
Very quickly, you might find yourself overwhelmed by:
- Too many signals firing at once
- Knowing you can’t act on all of them
- Not having a clear rule to filter out weak ones
In this state, traders often:
- Pick the signals that simply look good
- Choose signals only after seeing how they played out
- Change their decision again and again
Each trader has their own view and decision. But this level makes one thing obvious:
More information does NOT necessarily create greater clarity.
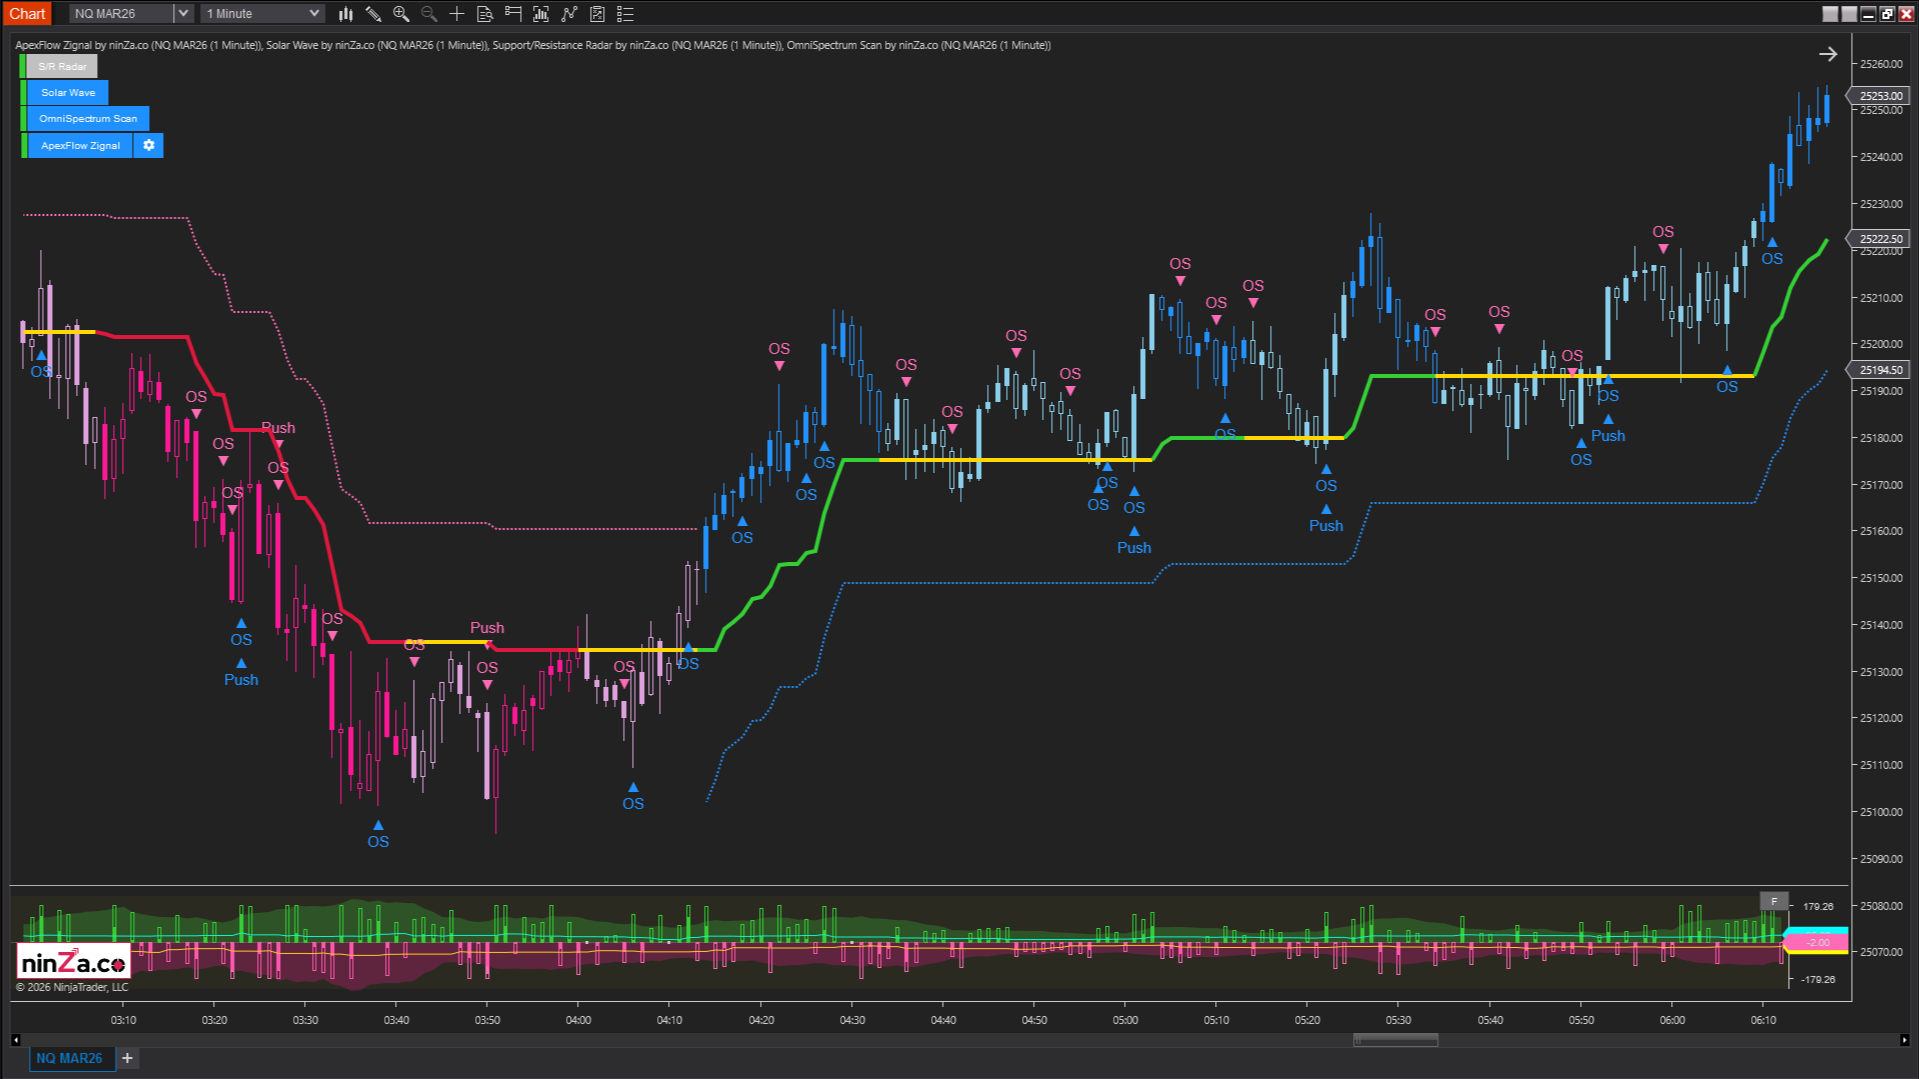
Level 2 – Add Trend
Image 3
Now imagine this:
The chart is still filled with Buy/Sell signals, but this time there’s one more piece of information.
It’s not an entry signal. It’s just a hint about the market’s overall direction – the trend bias.
From here, the question is: “Which signal should you take?”
You might start to notice that:
- Some signals naturally lose validity
- A few options you were considering fall away
- You no longer have to think as hard to filter them
At this level, several signals stop qualifying – not because they were wrong, but because they no longer align with the broader context.
Level 3 – Add Zone
Image 3
The trend is now clear, but the chart still presents many possible entry points.
So, let’s add one more layer of clarity. Key price zones appear – areas where the market has reacted strongly in the past.
The final question is: “Which signals make sense to trade?”
You might find yourself ignoring most of the signals. Your attention naturally shifts toward the zones that truly matter.
And once that happens, the urge to rush into trades fades.
You finally have a reason to wait… to wait for a setup clear enough to deserve a trade.
Pause here!!!
A shift in how you see the market…
Take a moment to look back at how you just analyzed the chart.
You moved from price → trend → zones → signals. That’s a structured, logical sequence.
But in real trading, most traders don’t follow this path. They jump straight to the signals.
A Buy arrow, a Sell marker – and their mind is already halfway into the trade. They pick whatever looks “promising”.
No trend.
No zone.
No context.
Just the signals.
Only afterward do they start filling in the missing pieces. They explain the trend after they’ve already entered.
They draw zones to justify the position. They reshape the narrative to make the trade feel “right”.
Some don’t even bother with trend or zones at all. A signal appears – and that alone feels like enough to pull the trigger.
In other words, their decision-making begins with the signal – NOT the market. And that’s why:
- They keep switching indicators
- They keep asking which signal feels “better”
- They rarely feel any real sense of certainty
The experience you just went through was intentionally designed to move you in the opposite direction of how most traders approach the market:
- You began in a state of pure signal overload.
- So many signals that it was difficult to decide what mattered.
- Then, gradually, layers of context – Trend, Zone – were added.
- Each new layer naturally removed the weaker setups from your view.
There were no instructions telling you what you should do. You simply noticed it yourself:
“If I had this context first, I wouldn’t have chosen those signals.”
That moment is the psychological shift – a subtle but powerful change in how you interpret the chart.
The moment you realize: “There is a structure. And that structure doesn’t begin with signals.”
And this is where the most important part begins.
Ascension Path – UTF Basic
What you just experienced wasn’t a random scenario. It reflects the core structure of Ascension Path – the foundational layer of Universal Trading Framework (UTF).
UTF is a structured framework for understanding market behavior. It explains how a trading edge is formed, sustained, and ultimately unfolds before, during, and after a trade.
To make it practical, UTF is summarized through one foundational equation: E = (T × Z × S) × M
- E – Edge
- T – Trend
- Z – Zone
- S – Signal
- M – Management
Each component – Trend, Zone, Signal, and Management – plays a distinct role in shaping Edge (E).
Management, in particular, determines how you protect capital, optimize returns, and preserve Edge over time.
What Ascension Path truly addresses
Ascension Path defines the structured progression behind a professional trading decision-making process:
Trend → Zone → Signal → Management
When this sequence breaks down, the familiar problems traders face begin to appear:
- Collecting countless indicators without knowing what’s missing
- Seeing a signal → jumping into a trade immediately
- Focusing on signals yet still losing
- Losing → switching to a new indicator
- Winning → but having no idea why it worked
Ascension Path answers a question most traders can’t resolve clearly:
“Why can the same indicator work for some traders but NOT for others?”
The difference doesn’t lie in the indicator.
It lies in how that indicator is used within a complete, structured decision process – the very foundation of Ascension Path.
You can think of it as:
- A system’s structural backbone
- A systematic decision-making sequence
- A unified trading framework
All of these describe what Ascension Path represents.
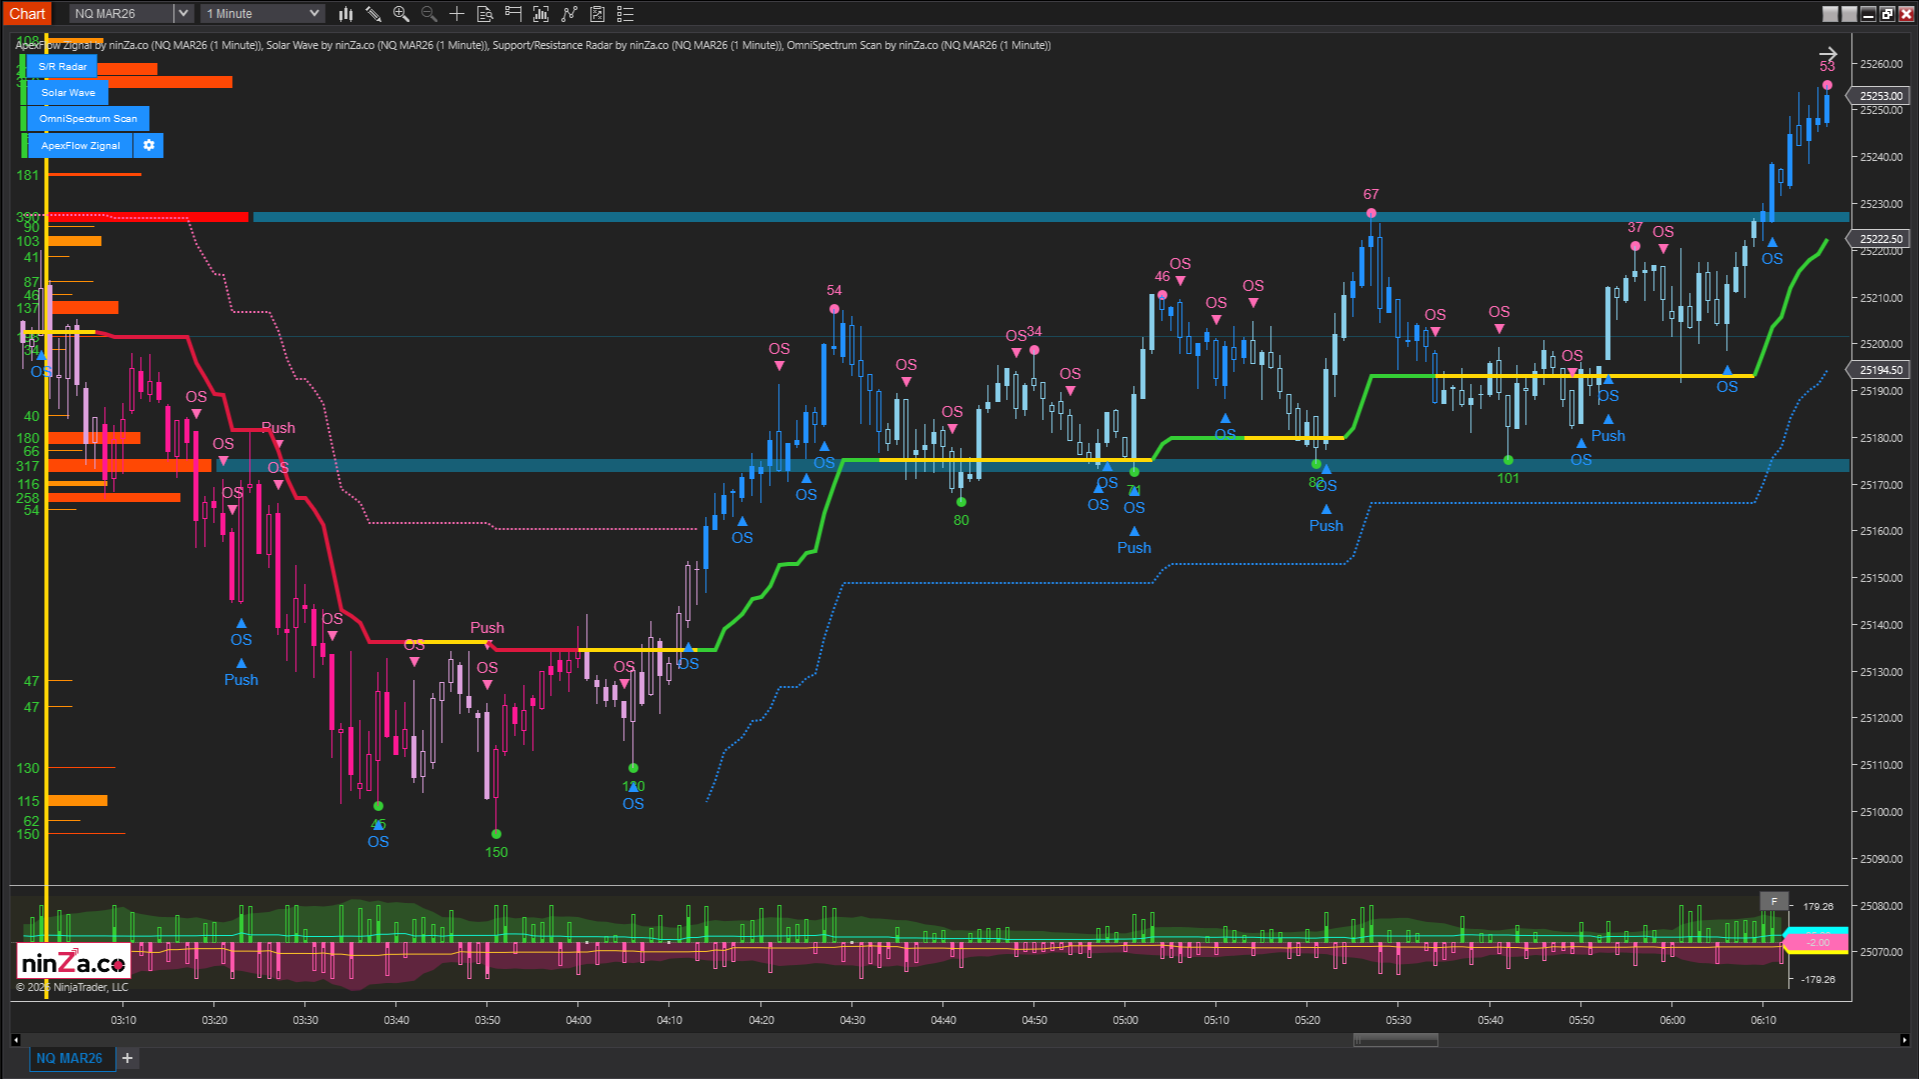
Example: A strategy built on Ascension Path
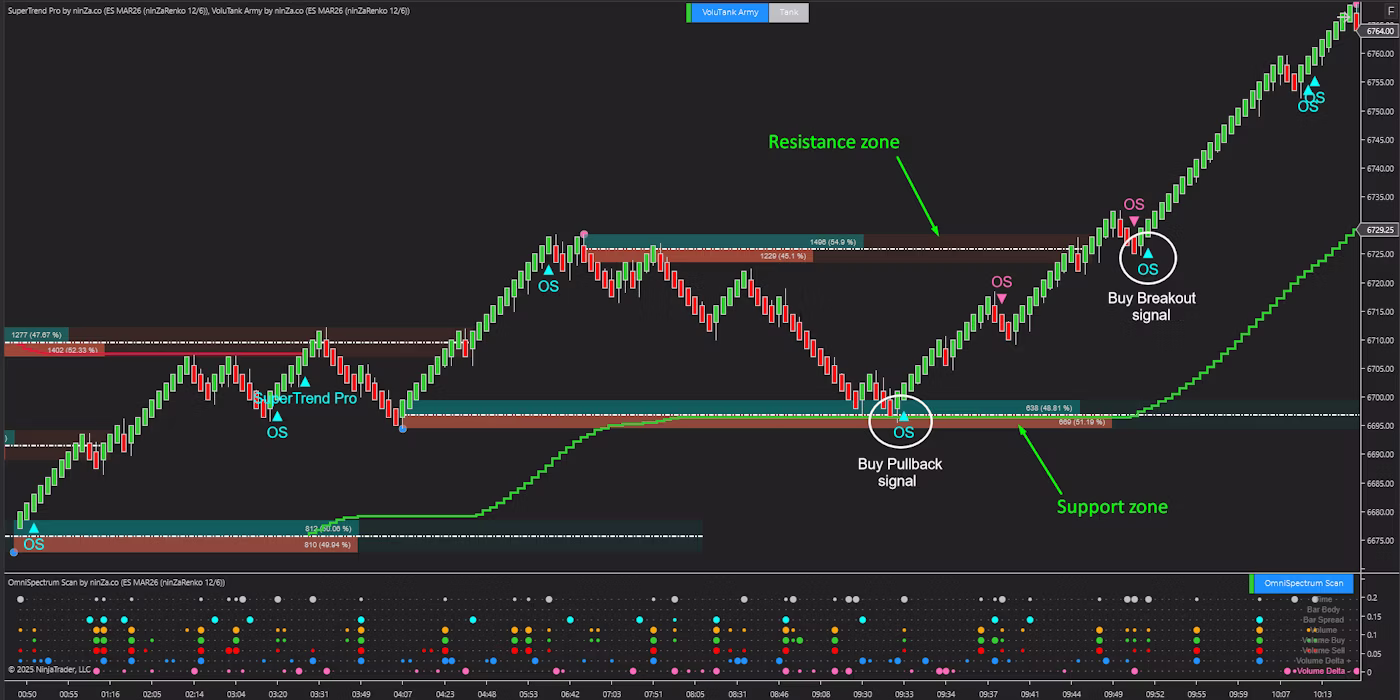
Ascension Path should now be clear as the structural logic behind a complete trading process. From here, we will examine how this framework translates into an actual, actionable strategy.
Image
Step 1 – Identify Trend
The trend is determined using SuperTrend Pro. On the chart above, it identifies the market as bullish, meaning:
- You think only in the direction of buying.
- All selling ideas are removed upfront.
- You avoid counter-trend trades and top-picking.
At this point, no trades are taken and all signals are ignored.
Step 2 – Identify Zone
Once Trend is established, the next step is to define Zone – the price areas that actually matter.
In this example, VoluTank Army highlights 2 key zones:
- Support zone
- Resistance zone
Because Trend is bullish, your focus narrows to 2 valid scenarios:
- A pullback into the Support zone → preparing for a buy setup
- A breakout through the Resistance zone → preparing for a continuation buy
At this point, your priority is clear: Identify the price areas where an entry would become valid.
Step 3 – Identify Signal
Trend set. Zone defined. Now you look for Signal. OmniSpectrum Scan provides it.
A Buy signal is valid only when it meets 2 criteria:
- It aligns with SuperTrend Pro’s bullish bias.
- It appears inside the zones defined by VoluTank Army
On the chart above, the 2 circled Buy signals meet both conditions.
→ These are the exact moments to execute a Buy under Ascension Path logic.
Final thoughts
Ascension Path you’ve just walked through isn’t a trading strategy. It’s not a Buy/Sell system either.
It is a foundational structure that every professional trader relies on to make decisions – whether they realize it or not.
At this stage, you’ve only touched the surface of UTF. But by now, you’ve grasped the core principles:
- Why Signal cannot stand on its own
- Why Trend and Zone are never secondary elements
- Why most losses come not from indicators, but from lacking structure
- And most importantly: You now see which part of your own strategy has been missing
If you want to go deeper and unlock the full UTF, you can access it here:
Email:
Button: Get FREE access to UTF